
Logistic map code
I use the logistic map with various r values to show different dynamics.
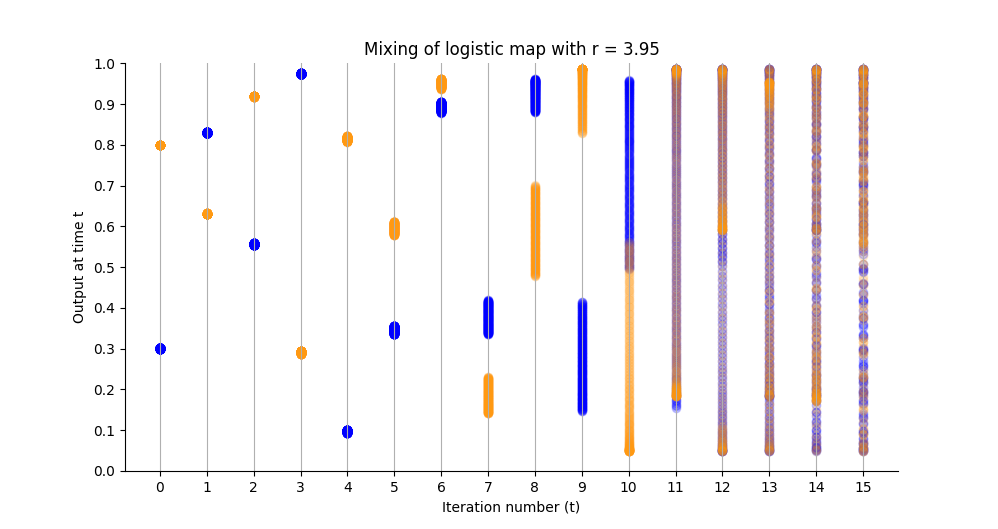
Note that in this example I set r = 3.95.
For those who want to check my work (or experiment themselves),
the data in the following figure was generated with this code,
and I used matplotlib.pyplot.scatter to generate the figure.
If you do change the r value, I suggest also playing with the t value, to see the system evolve over time.
import numpy as np

r = 3.95
def logistic_map_func(x):
    return r * x * (1 - x)
logistic_map_vec = np.vectorize(logistic_map_func)

start_cond1 = np.linspace(0.3, 0.301, 200) # blue
start_cond2 = np.linspace(0.8, 0.801, 200) # yellow

def iterate_to_t(t, start_cond):
    input_size = start_cond.size
    data = np.zeros((t + 1, input_size))

    data[0] = np.copy(start_cond)
    for i in range(1, t + 1):
        prev_data = np.copy(data[i - 1])
        new_data = logistic_map_vec(prev_data)
        data[i] = new_data

    return data

t = 15
data1 = iterate_to_t(t, start_cond1)
data2 = iterate_to_t(t, start_cond2)